Distributed Load Testing with K6
What is Load Testing?
Today, distributed systems are everywhere. When you open a mobile app, several servers are waiting for your interactions so they can send a response. When you interact with your bank via web, more servers are prepared to access your data and return information about your balance and the movements in your accounts. All these servers are distributed around the world to give you the fastest response when the system is working properly. To measure the functionality of the servers, load testing is key: create demand and measure the system's response.
Since you need servers to launch load tests to other servers, there are several tools in the industry that exist specifically for that purpose. Some companies offer SaaS and/or enterprise solutions to test your system; for a monthly or yearly rate, you can trigger the tests from their infrastructure. There are also open-source solutions to self-host the machines used to launch the load tests. In that case, the operational cost of the solution increases, but the infrastructure cost decreases because you are able to choose the servers.
Previous Solution with JMeter & Taurus
Here at Empathy.co, if an open-source solution exists, it is typically contributed to the community. Such was the case when measuring service performance using JMeter and Taurus.
JMeter has the ability to launch load tests with many different protocols such as SOAP, REST, HTTP, HTTPS, FTP, TCP, LDAP, SMTP, POP3, IMAP, etc. Taurus lets you automate the process of running JMeter scripts and getting BlazeMeter reports, complete with insights about server performance and a summary of the test.
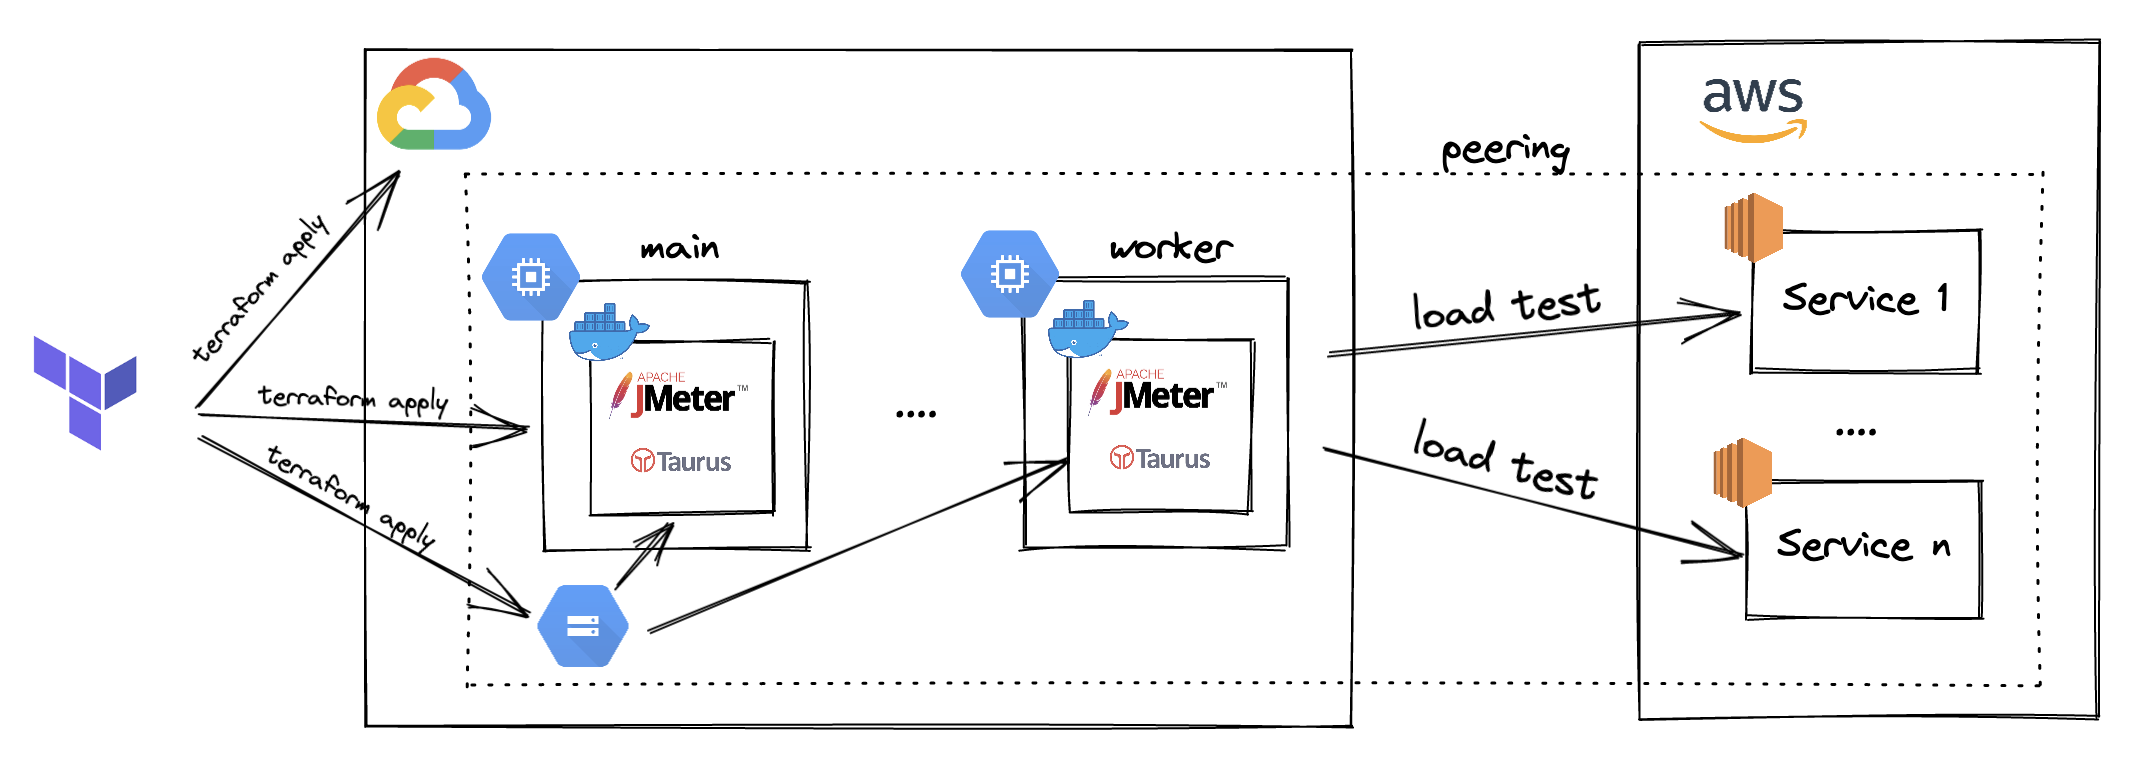
The way JMeter and Taurus were used to perform these tests is complex. The services for the SaaS offering at Empathy.co are running in AWS, so to replicate the way users are triggering requests to these services, our platform team created a Terraform module. Doing so allowed us to set up the necessary infrastructure in GCP and made it possible to reach the maximum limit of incoming requests from outside AWS.
The Terraform module creates a GCP project and the required VMs to launch distributed load testing using a custom instance template; including a user data script to set up all the installation for JMeter and Taurus via Docker. It should be noted that the process and the upgrading of these technologies is tedious and boring.
Apart from that, as some services are internal and not exposed to the internet, network peering between AWS and GCP should be also created. This is necessary to trigger the tests from GCP and reach those internal AWS services. If you have ever tried to create peering between two different public cloud providers, like GCP and AWS, you probably know the process is not trivial.
Once everything is in place, one VM is used as the main to run the load test. The rest of the VMs are workers, which trigger the queries to the AWS services.
The main goal of using JMeter and Taurus is to gain insight into how many servers Empathy.co needs for important ecommerce shopping events like sale seasons, Black Friday, or Blue Monday, as those are the times when our customers receive massive amounts of traffic in their online stores. Some even choose to close their online business for a determined amount of time (normally an hour) and then reopen their website to shoppers. The FOMO created results in queries being triggered in a rapid-fire manner in a very short period of time.
The problem here is that instead of triggering load and performance tests during the development process, they are launched a few weeks before important ecommerce shopping events. In the meantime, the GCP infrastructure is deleted to save costs, preventing the ability to trigger the necessary tests.
There are better ways to approach and avoid this problem.
What is K6?
While researching new ways to trigger load and performance tests, some alternatives appeared on our radar. After some analysis, K6 seemed to perfectly fit Empathy.co's workloads. K6 is created by Grafana Labs and the engineering community, as it is open-source.
Under the hood, K6 is written in Go and uses a JavaScript runtime to allow users to write load test scripts in JavaScript. The best way to understand its benefits is by reading the awesome docs!
Install K6 CLI
The ideal method to begin using K6 is by installing the CLI. The installation guide clearly explains the steps for the different machines. For MacOS, you just need to run:
brew install k6
Run K6 from localhost
After installing K6 CLI, you will be able to run load tests from localhost. Following the steps in this guide, setting up a test is easy. First, create a script.js file with the following content:
import http from 'k6/http';
import { sleep } from 'k6';

export default function () {
  http.get('https://test.k6.io');
  sleep(1);
}
Then, run the script in your terminal:
k6 run script.js
After a few seconds, you should see output appear in the terminal like this:
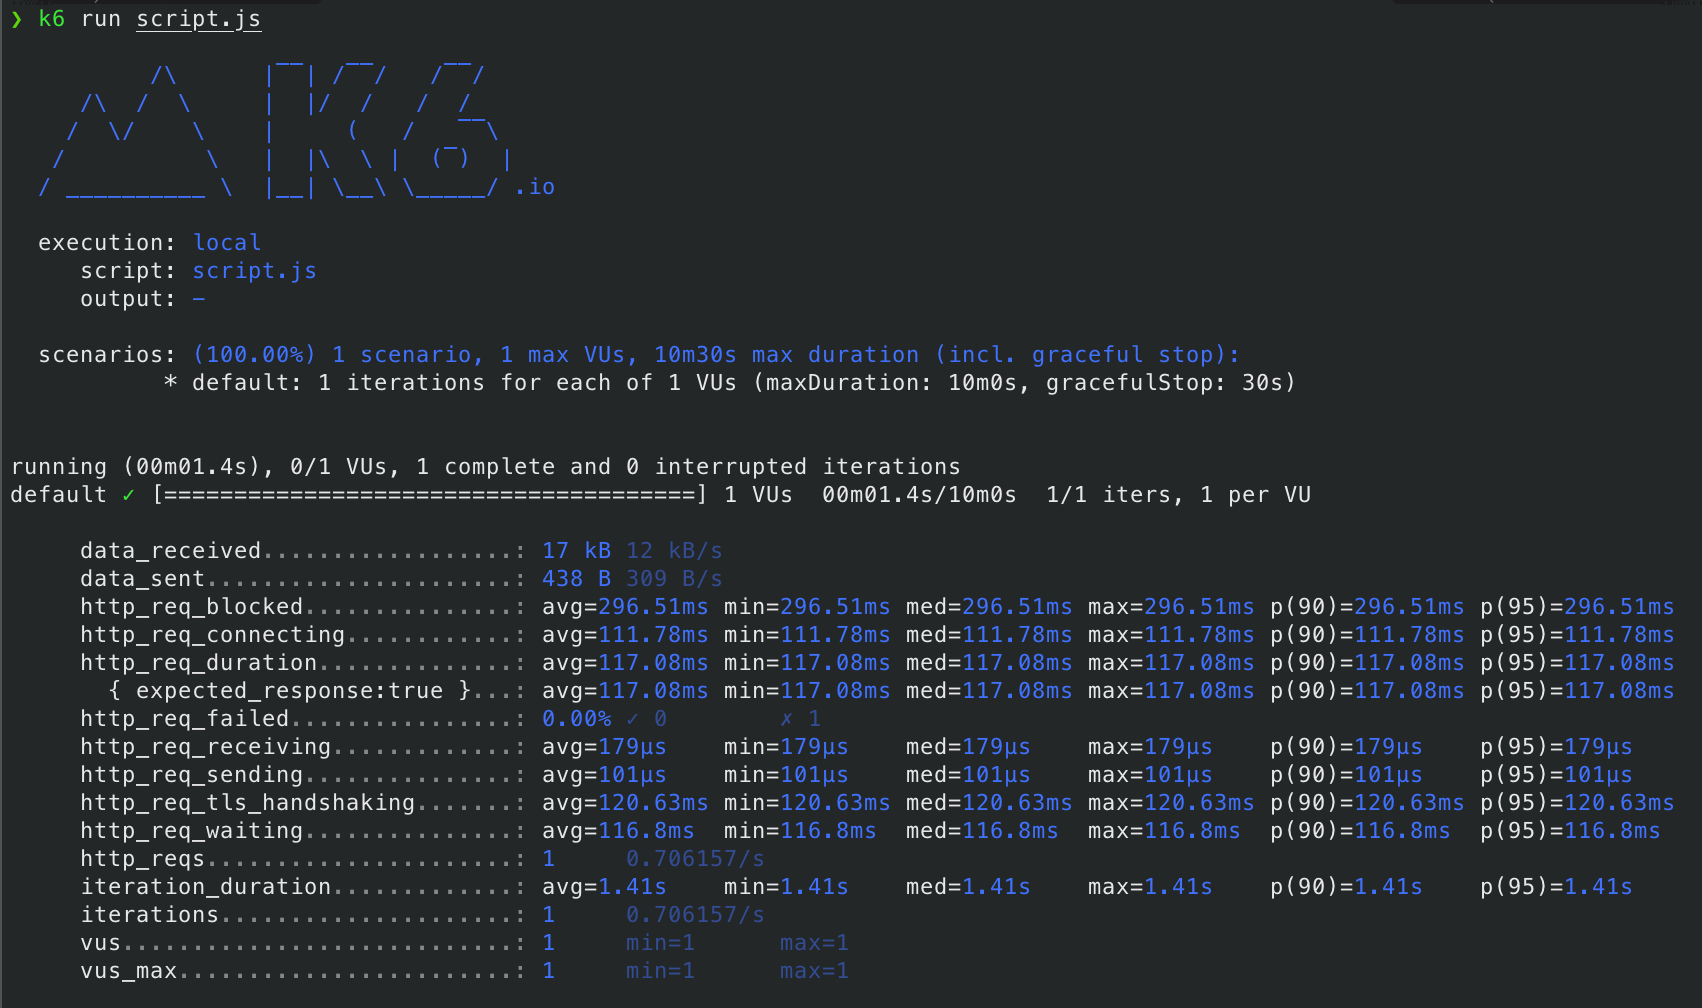
The test triggered an HTTP GET request to https://test.k6.io as an example and after one second, the test ended.
If you would like to increase the number of requests and the duration, you can trigger the same script with some additional options, such as virtual users and duration:
k6 run --vus 10 --duration 30s script.js
Doing so changes the output:
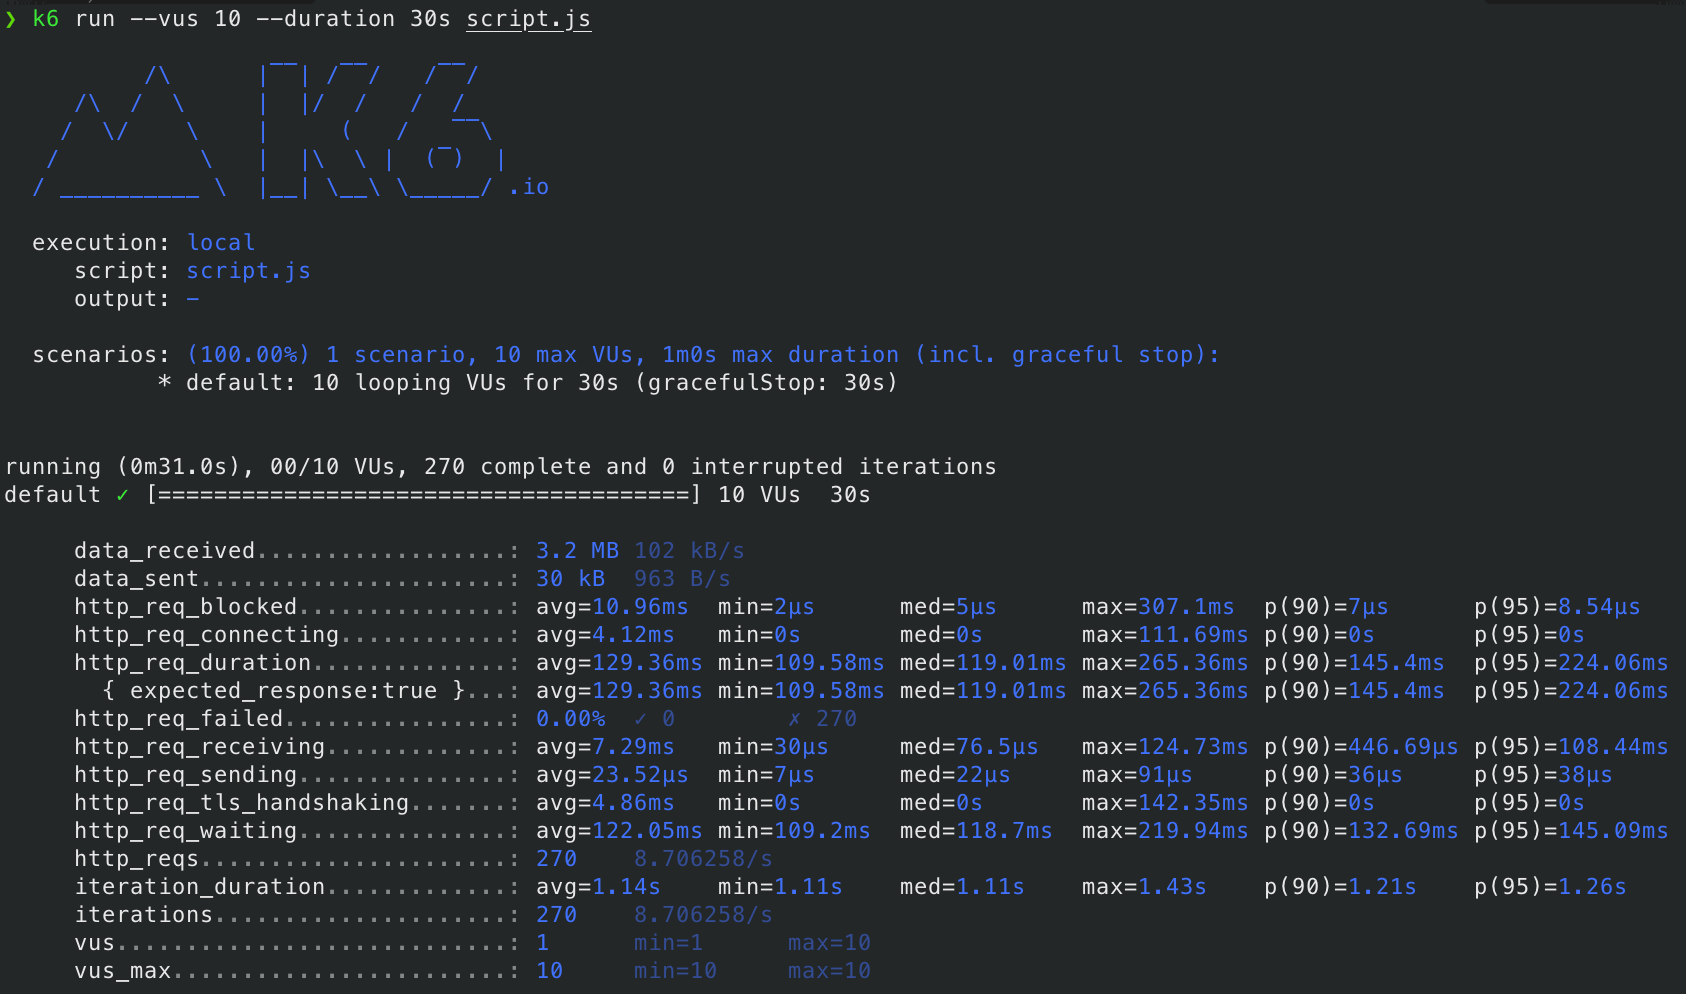
To explore the different optional parameters, take a look at the official reference.
Run K6 from CI/CD
Running load tests from localhost is very useful for easily checking the performance of a service. However, your localhost machine may reach your resource limits if the load test is triggering a large number of virtual users. In this section of the documentation, you can find relevant information about the limits and some benchmarking for running K6 in AWS.
To avoid overwhelming your local machine when running load tests, you can set up K6 in your CI/CD pipeline as part of your Continuous Deployment process. After the deployment of a new version of a service, K6 can be triggered via GitHub Actions, Jenkins or any other CI/CD tool to test the performance of the new version.
Here are references on how to run K6 within a GitHub Action and how to integrate K6 in Jenkins.
K6 Operator for K8s
One of the most useful features of K6 is the ability to run distributed load testing. Using distributed load testing, you can reach however many queries/second you would like to. In order to run these tests, you need to set up different servers and coordinate them to trigger the queries simultaneously.
At Empathy.co, almost every workload is running in Kubernetes. For that reason, the K6 operator fits this use case perfectly. You can follow these instructions to learn how to install the K6 operator and trigger K6 tests from your K8s cluster.
Essentially, the steps are:
- Clone the K6 operator repository:
git clone https://github.com/grafana/k6-operator && cd k6-operator
- Deploy the operator using
make:
make deploy
- Write a test script named
test.js:
import http from 'k6/http';
import { check } from 'k6';

export const options = {
  stages: [
    { target: 200, duration: '30s' },
    { target: 0, duration: '30s' },
  ],
};

export default function () {
  const result = http.get('https://test-api.k6.io/public/crocodiles/');
  check(result, {
    'http response status code is 200': result.status === 200,
  });
}
- Deploy the test script:
kubectl create configmap crocodile-stress-test --from-file test.js
- Create the custom resource (CR) named
custom-resource.yaml:
apiVersion: k6.io/v1alpha1
kind: K6
metadata:
  name: k6-sample
spec:
  parallelism: 4
  script:
    configMap:
      name: crocodile-stress-test
      file: test.js
- Deploy the custom resource:
kubectl apply -f custom-resource.yaml
This will launch the load test, the previously creates script in a distributed manner, running the test in four distributed Pods as indicated in the parallelism field.
Custom K6 Image
The default K6 image doesn't include the ability to export metrics from each Pod running the distributed test to Prometheus. To attain these metrics, it is necessary to install a K6 extension to the default K6 image, such as the xk6-prometheus extension.
To install the extension, create a custom K6 image with the following Dockerfile:
# Build the k6 binary with the extension
FROM golang:1.18.1 as builder

RUN go install go.k6.io/xk6/cmd/xk6@latest
RUN xk6 build --output /k6 --with github.com/szkiba/xk6-prometheus@latest

# Use the operator's base image and override the k6 binary
FROM loadimpact/k6:latest
COPY --from=builder /k6 /usr/bin/k6
Upload the custom image to your preferred registry and use it as a runner, like in the following example:
apiVersion: k6.io/v1alpha1
kind: K6
metadata:
  name: k6-sample
spec:
  parallelism: 18
  script:
    configMap:
      name: crocodile-stress-test
      file: test.js
  arguments: --out prometheus=namespace=k6
  ports:
    # Port where K6 exposes Prometheus metrics
    - containerPort: 5656
      name: metrics
  runner:
    # Docker image to use in the K6 Pods
    image: <REGISTRY>/<IMAGE>:<VERSION>
Remember to change the <REGISTRY> , <IMAGE> and <VERSION> for your custom values.
As all the Pods are going to expose the metrics to Prometheus, you could take advantage of the opportunity to create awesome dashboards in Grafana. They are very helpful for development teams to check the insights of the distributed tests in a single place.
K6 & Argo workflows
To make running load tests in Kubernetes easier for developers, Argo Workflows is used in order to handle the load testing activities. It provides a useful UI for passing the parameters of the test, checking its progress, a CLI to trigger the workflows, etc.
As an important part of the Platform Engineering team methodology here at Empathy.co goes:
you build it, you own it.
Next, follow the instructions to install Argo Workflows in your cluster.
Once Argo Workflows has been installed, you just need to create a template to trigger the tests from the UI, CLI or use cURL.
The following is an example of a template for triggering K6 tests:
apiVersion: argoproj.io/v1alpha1
kind: WorkflowTemplate
metadata:
  name: k6-template
  namespace: {{ .Values.namespace }}
spec:
  serviceAccountName: k6-operator-k6-crds
  entrypoint: main
  arguments:
    parameters:
    - name: team
      value: 'team'
    - name: scriptName
      value: 'k6-test-real-data.js'
    - name: configurationMode
      value: file
    - name: configurationFile
      value: 'test-config.json'
    - name: parallelism
      value: 10
    - name: k6RunnerImage
      value: 'k6:v0.2.0'
    - name: cpuRequests
      value: '2000m'
    - name: cpuLimits
      value: '2000m'
    - name: memoryRequests
      value: '4Gi'
    - name: memoryLimits
      value: '4Gi'
  activeDeadlineSeconds: 10800 # 3h
  ttlStrategy:
    secondsAfterCompletion: 10 # 10s
  templates:
    - name: main
      inputs:
        parameters:
        - name: team
        - name: scriptName
        - name: configurationMode
        - name: configurationFile
        - name: parallelism
        - name: k6RunnerImage
        - name: cpuRequests
        - name: cpuLimits
        - name: memoryRequests
        - name: memoryLimits
      steps:
      - - name: k6-test-delete
          template: k6-test-delete
          arguments:
            parameters:
              - name: team
                value: "{{`{{inputs.parameters.team}}`}}"
      - - name: k6-test-create
          template: k6-test-create
          arguments:
            parameters:
              - name: team
                value: "{{`{{inputs.parameters.team}}`}}"
              - name: scriptName
                value: "{{`{{inputs.parameters.scriptName}}`}}"
              - name: configurationMode
                value: "{{`{{inputs.parameters.configurationMode}}`}}"
                enum:
                  - file
                  - json
              - name: configurationFile
                value: "{{`{{inputs.parameters.configurationFile}}`}}"
              - name: parallelism
                value: "{{`{{inputs.parameters.parallelism}}`}}"
              - name: k6RunnerImage
                value: "{{`{{inputs.parameters.k6RunnerImage}}`}}"
              - name: cpuRequests
                value: "{{`{{inputs.parameters.cpuRequests}}`}}"
              - name: cpuLimits
                value: "{{`{{inputs.parameters.cpuLimits}}`}}"
              - name: memoryRequests
                value: "{{`{{inputs.parameters.memoryRequests}}`}}"
              - name: memoryLimits
                value: "{{`{{inputs.parameters.memoryLimits}}`}}"

    - name: k6-test-delete
      inputs:
        parameters:
          - name: team
      resource:
        action: delete
        flags: [
          "k6", "k6-{{`{{inputs.parameters.team}}`}}"
        ]
    - name: k6-test-create
      inputs:
        parameters:
          - name: team
          - name: scriptName
          - name: configurationMode
          - name: configurationFile
          - name: parallelism
          - name: k6RunnerImage
          - name: cpuRequests
          - name: cpuLimits
          - name: memoryRequests
          - name: memoryLimits
      outputs: {}
      metadata: {}
      resource:
        action: create
        manifest: |
          apiVersion: k6.io/v1alpha1
          kind: K6
          metadata:
            name: k6-{{`{{inputs.parameters.team}}`}}
          spec:
            parallelism: {{`{{inputs.parameters.parallelism}}`}}
            script:
              volumeClaim:
                name: k6-runner-tests
                file: {{`{{inputs.parameters.team}}`}}/test/{{`{{inputs.parameters.scriptName}}`}}
            arguments: --out prometheus=namespace=k6 -e CONFIGURATION_MODE={{`{{inputs.parameters.configurationMode}}`}} -e CONFIGURATION_FILE={{`{{inputs.parameters.configurationFile}}`}}
            ports:
            - containerPort: 5656
              name: metrics
            runner:
              image: <REGISTRY>/{{`{{inputs.parameters.k6RunnerImage}}`}}
              resources:
                requests:
                  cpu: {{`{{inputs.parameters.cpuRequests}}`}}
                  memory: {{`{{inputs.parameters.memoryRequests}}`}}
                limits:
                  cpu: {{`{{inputs.parameters.cpuLimits}}`}}
                  memory: {{`{{inputs.parameters.memoryLimits}}`}}
        successCondition: status.stage in (finished)
The easiest way to run the load tests is through the workflow template created in the Argo Workflows. To run the load test using the Workflow Template, follow these steps:
- Head to the Argo Workflows UI and select the Workflows section from the left side menu.
- Type
k6in the namespace filter to filter workflows ofk6namespace. - Click Submit new Workflow button and select the workflow template named as
k6-template. - Populate the template fields with the values for your load test:
Template fields
Entrypoint
Starting point of the workflow. This always must be set to <default>.
Team
Name of the team performing the Load Test.
scriptName
Script used to run the test.
parallelism
Number of K6 Kubernetes Pods used to distribute the test.
k6RunnerImage
K6 runner image name.
cpuRequests
Required amount of CPU for each Pod to run.
cpuLimits
Maximum amount of CPU for each Pod to use. This should be carefully set, as a Pod trying to use more CPU than specified here will cause Kubernetes to throttle the CPU usage of the containers.
memoryRequests
Minimum amount of RAM for each Pod to run.
memoryLimits
Maximum amount of RAM for each Pod to use. This should be carefully set, as a Pod trying to use more RAM than specified here will cause Kubernetes to kill the containers.
- Click Submit.
Once triggered, the workflow will automatically start a new Pod that will then spawn the K6 Pods that run the load test.
After finishing the load test, the workflow will also delete all the remaining Pods.
Next Steps
With Argo Workflows, you can save developers a lot of time, but there is still a chance to automate the usage of K6 even more.
Using Argo Rollouts, you can set deployment strategies and use canary or blue-green deployments to test new service versions with K6. It is possible to set up thresholds to validate the new service version using K6 metrics. However, if those metrics are worse than expected, the new deployment could be rolled back automatically without manual intervention and with high availability of the service.
Summary
K6 is a powerful open-source tool for triggering load tests to your services. The K6 operator facilitates the installation of the tool, in order to launch distributed tests along with your Kubernetes infrastructure.
The way tests are triggered is extensible, which allows you to build a custom image. That means you could, for example, run your tests to include a Prometheus exporter to the K6 runners. You could also create your own extension to contribute to the community!
Adding Argo Workflows to the mix will help developers save time by triggering tests directly from the UI, using the CLI, or via cURL instead of creating CRs in your Kubernetes cluster manually.