Image & Color Recognition: A Practical Example
Categories
We’ve all heard about Image Recognition and how it impacts our day-to-day activities. From the impressive automated driving software that some automobile companies have implemented in their vehicles, to the cool smartphone app that tells us what kind of bird we are staring at – most of us know what the concept of Image Recognition is, more or less. Of course, it might seem like a very complex field (and, well, it is actually tricky sometimes), but we can also do some interesting experiments that will show us how this is, indeed, a very promising area to try out.
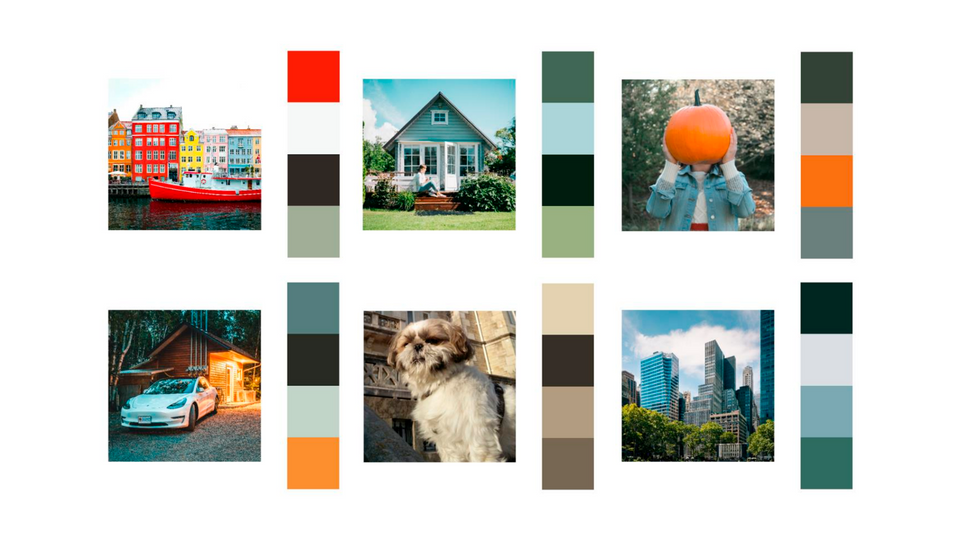
Given how broad the field is, the experiment that we are going to perform and assess is focused on a smaller area within it: Color Recognition. The goal is to create an efficient process that can extract the dominant colors from any given picture.
Color Recognition: The Basics
This area is one of the most explored in computer vision, as it is much easier to collect and classify data, and it is pretty straightforward to test results. It is not difficult for an average person that does not experience colorblindness to see an image of a jacket and identify the main colors that are present on it; nor is it for a computer to do the same, with the appropriate solution.
Of course, nowadays there are already professional solutions on the market that tackle this problem in a very complete way, like the Google Vision AI project or the Amazon Rekognition service. But, in this case, we are going to build our own, homemade Color Recognition system with Python and some added libraries.
The Experiment
First of all, it is important to know what we want to obtain: a system that can take an image, process it, and return a set of the four main colors. Plus, we want to do it in the simplest and most efficient way possible.
Now that we have and overview of Color Recognition and a clear idea of what our objectives are, we can start with the implementation itself. To illustrate the experiment, let’s go through a guided, step-by-step example.
Step 1: Process the image to be analyzed
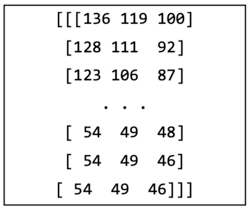
The first step of the experiment is to “read” the image. Use the Numpy and OpenCV libraries to translate the picture into a matrix of data corresponding to the colors in RGB code, assigning each pixel a value between 0 and 255.
The matrix obtained will be similar to this one, which has been shortened for obvious reasons:
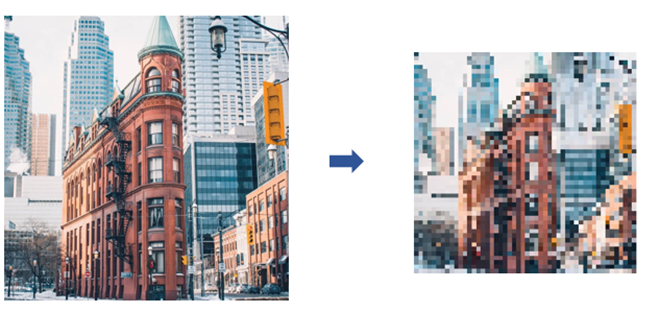
Step 2: Resize the picture
Next, it is time to resize the image using the OpenCV library. At a low level, this step means converting the big data matrix into a smaller one. Reducing the number of pixels in the image avoids introducing noise into the color processing phase.
Moreover, the fewer pixels that are in the final image, the less time the color recognition process will take. Of course, this has some drawbacks, the most significant one being that having fewer pixels can also affect the accuracy of the recognition. In order to find the best ratio for the resizing process and avoid compromising that accuracy, iterate! Iterating measures the time taken for the whole process to be completed and determines the pixels required.
For this example, it was necessary to iterate through several versions of the size of the pixel matrix (300, 200, 100, 50, 35, 25, and 10). The ideal size for the data matrix was 35, which is important to keep in mind.
Step 3: Apply K-Means clustering
The analysis of the image and subsequent color classification is performed with a technique called K-Means clustering. K-Means is a non-supervised algorithm that aims to partition n objects into k groups (called clusters). While there are more specific techniques to get a more accurate number of clusters, for the sake of simplicity, they won’t be explored in this article.
Now that the image has been resized to the proper measurements, it is time to use the SKLearn library to get to the most interesting part of the clustering process. In this case, a total of four clusters will be used, because that is the number of dominant colors to be extracted from the picture.
Step 4: Extract colors
Once the K-Means algorithm has finished computing, the results have to be extracted using the Numpy library.
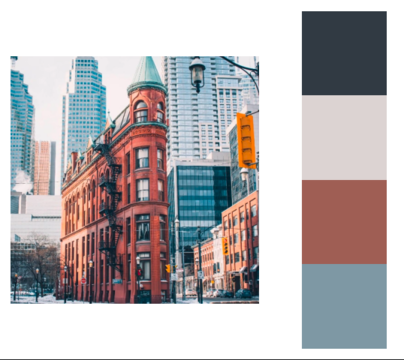
After some refactoring, the result of this step is an array containing the four most dominant colors of the image analyzed:
The only thing left to do is check the color codes! It looks like a very good match between the picture analyzed and the dominant colors extracted:
Conclusion
That’s it! With those four simple steps, we have created our own Color Recognition system. Of course, the application and different uses will vary, depending on the project at hand, but there is a clear approach to follow.
Here at Empathy.co, our goal is to create captivating Search experiences for shoppers and Image Recognition can play an important role in doing so. A perfect example of this is the ability to filter by color that a lot of online stores have. The data required for those filters to work comes (usually, but not always) from a system like the one we created in this experiment. There are also more advanced uses for this, like automated tag systems that label products based on their images and assign them to specific categories. This is a very interesting field, for sure, and now you’re ready to dive into it!