Cloud FinOps - Part 4: Kubernetes Cost Report
Categories
This blog post is a continuation of Cloud FinOps - Part 3: Cloud Cost Report, in which we will explore how to gain cost visibility on Kubernetes Workloads.
Motivation
Nowadays, a lot of companies run their workloads on Kubernetes because there are many benefits to choosing Kubernetes as the main solutions orchestrator for microservices. Although there is some visibility of cloud costs from the main public cloud provider, costs from within the Kubernetes cluster tend not to be clearly defined.
Some solutions have already been created to tackle this lack of data, such as Vantage.sh and Kubecost, and gain Kubernetes Cost Visibility. Before going ahead with this solution proposal, the Platform Engineering team Empathy.co explored two Kubecost options: Kubecost as a Prometheus metric explorer and the Kubecost Helm Chart.
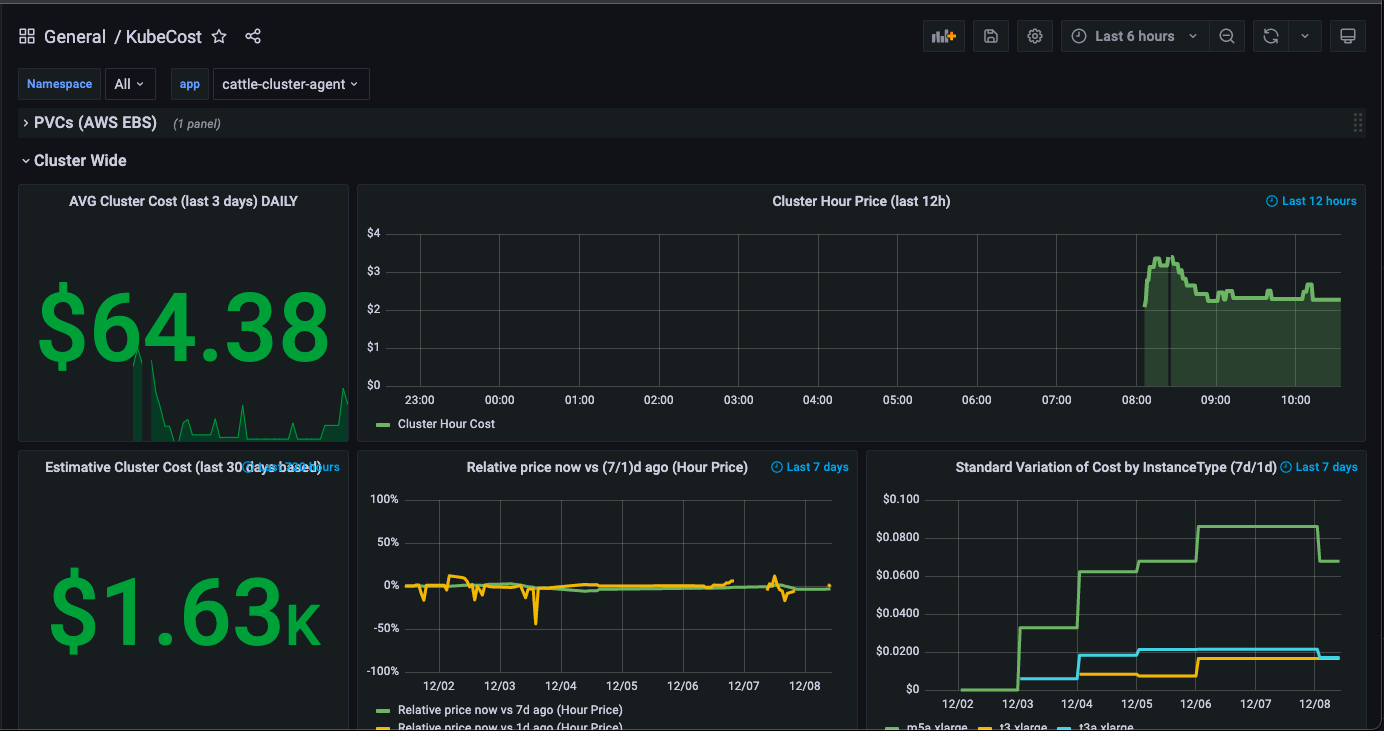
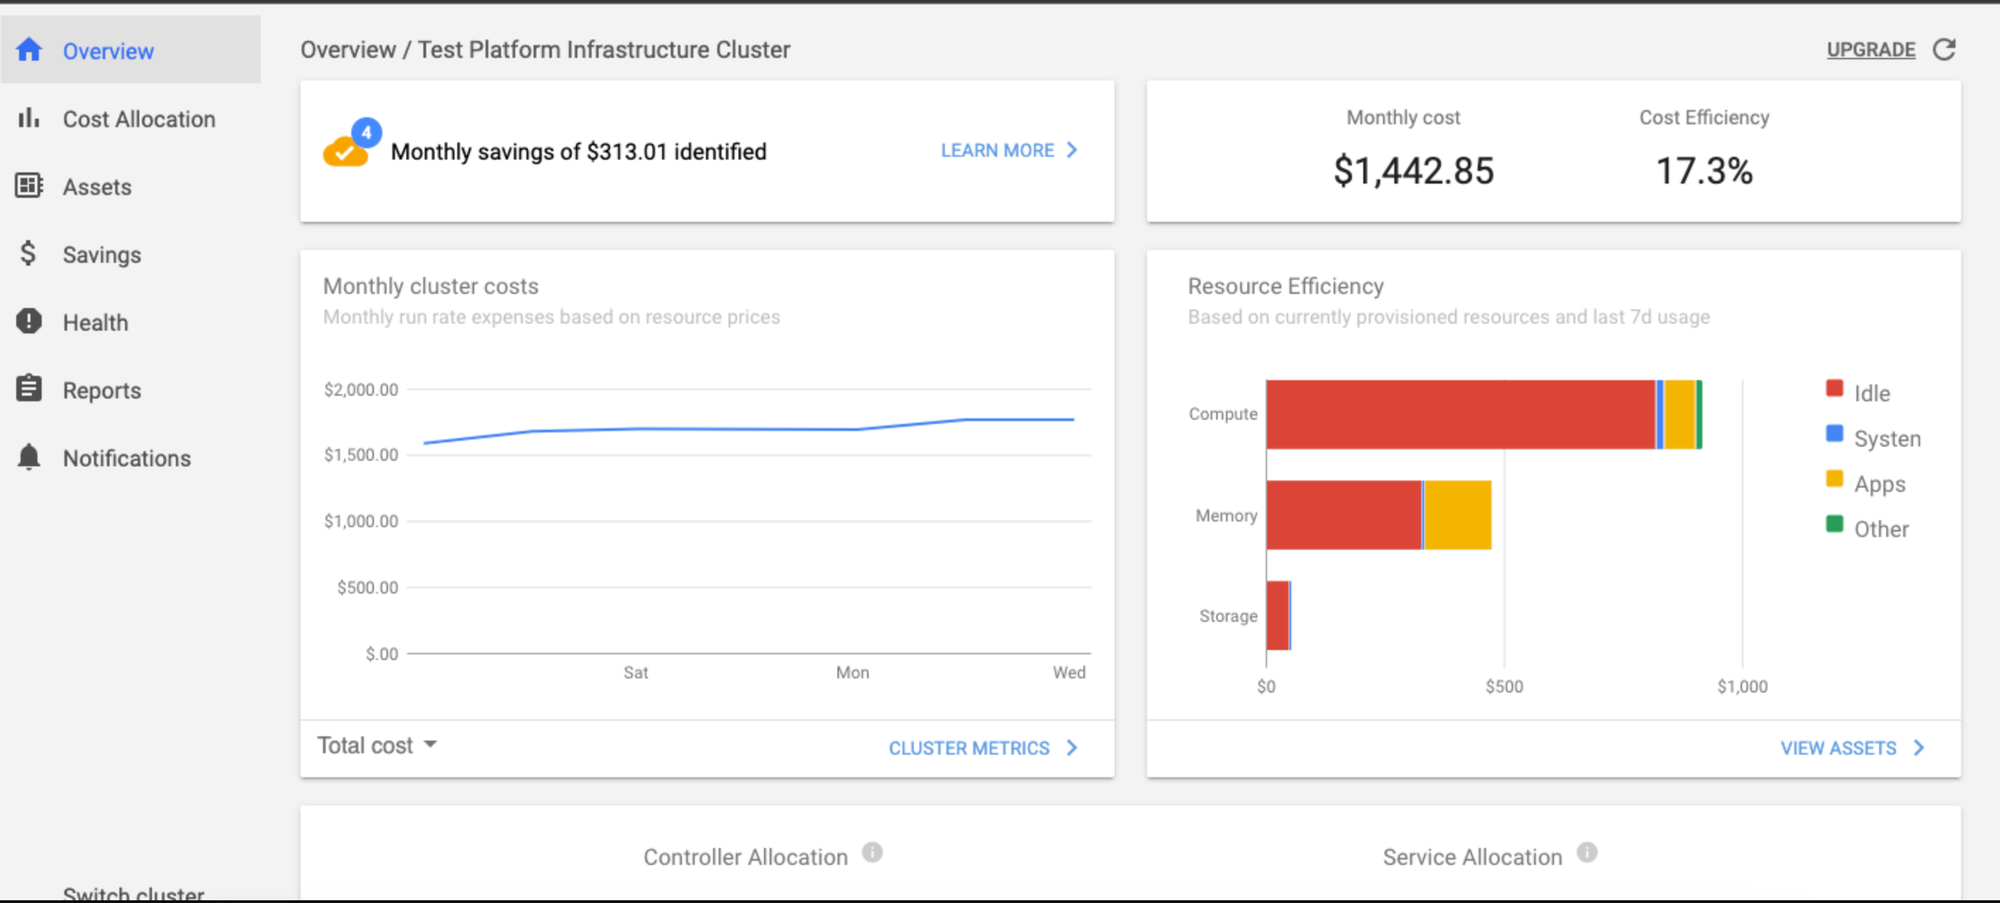
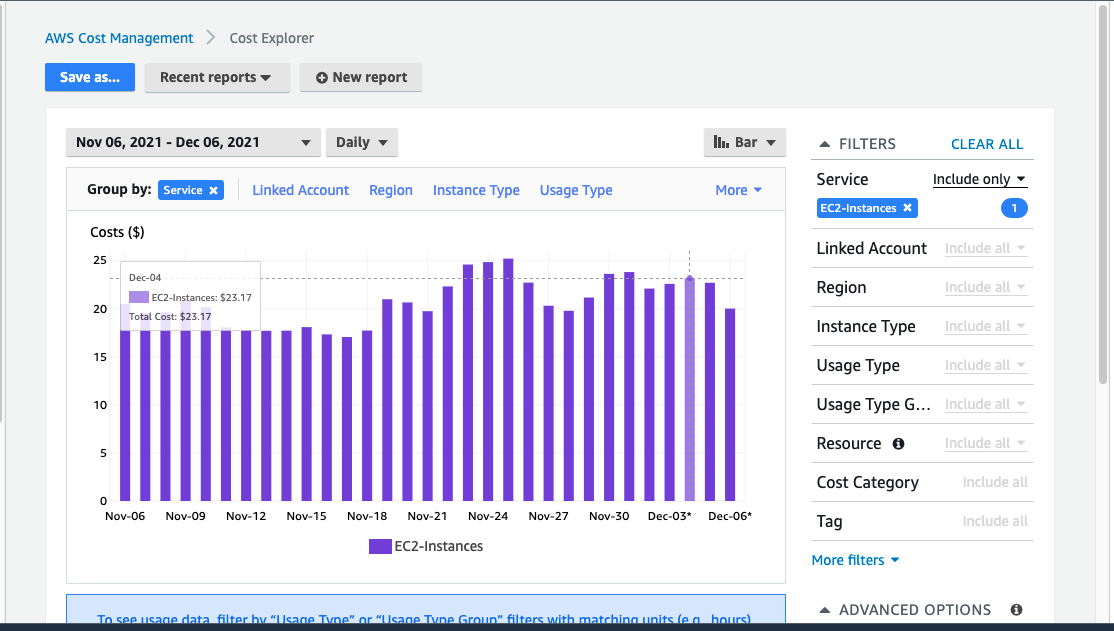
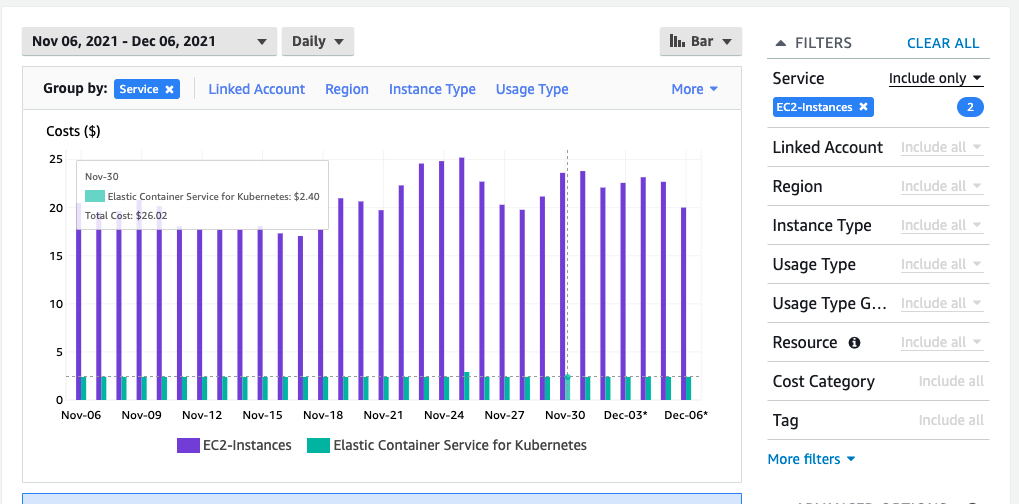
In the graphs above, Kubecost doesn’t show the same cost per cluster, nor is the price correlated with those in AWS Cost Explorer:
- Kubecost reports approximately $65/day
- CostExplorer reports around $23/day for EC2 instances and approximately $2.40/day for EKS Free
It’s a significant difference, therefore we investigated other approaches as we began to create our own dashboards, based on autoscaling instance type info.
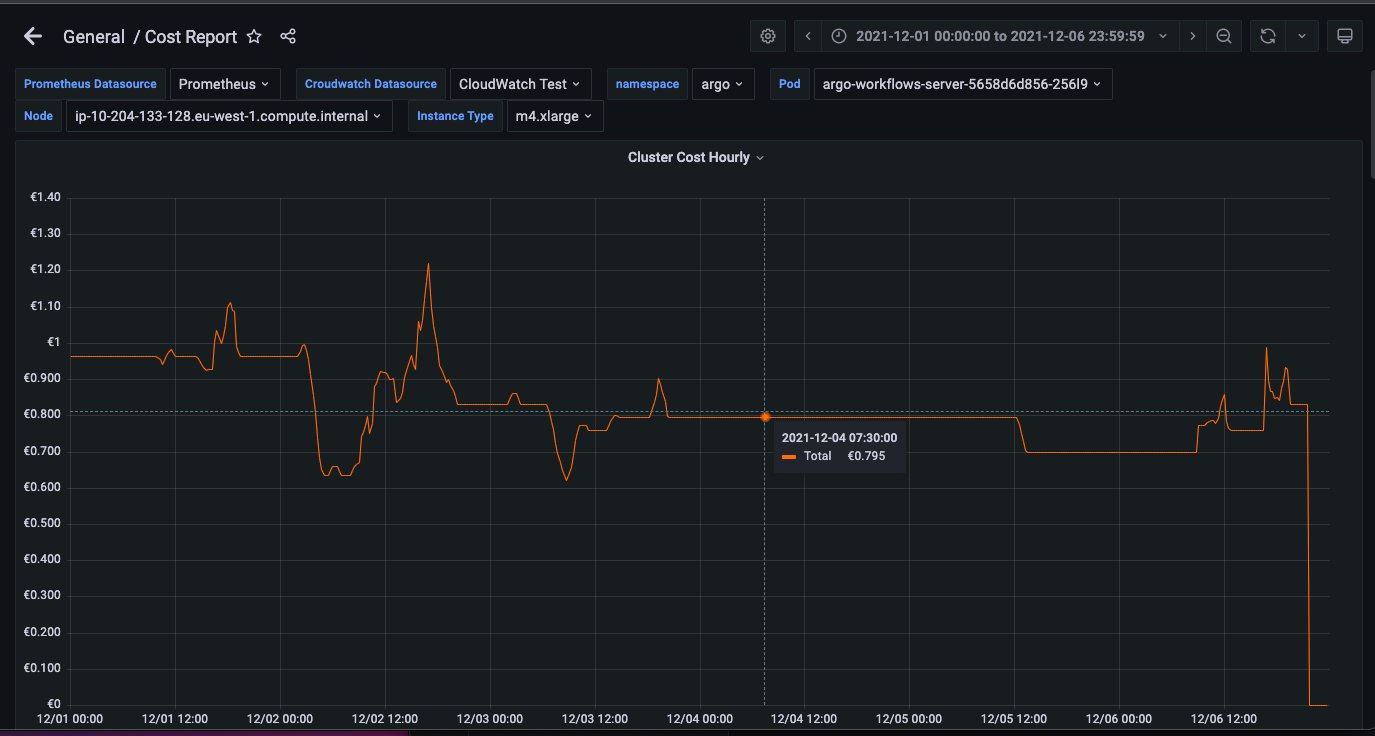
Grafana Dashboard Cluster Cost Hourly based on Autoscaling info for the first week of December 2021
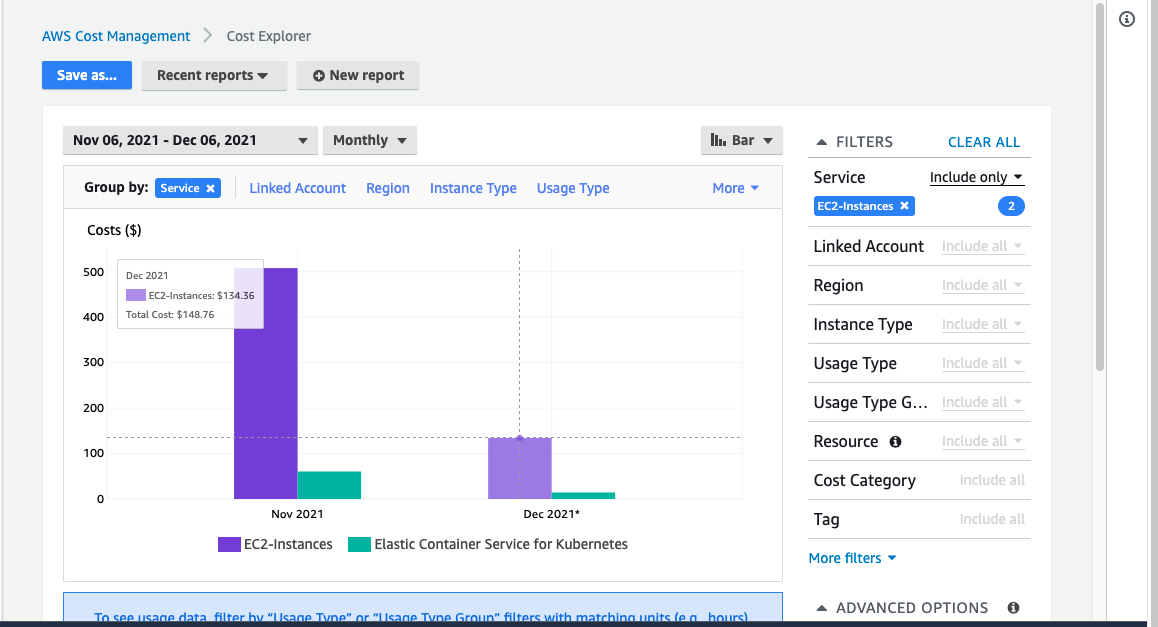
AWS Cost Explorer for first week December 2021
Calculating the average of the first week of December 2021, based on the Autoscaling instance type, the corresponding costs using the following tools are:
- $0.795/hour * 24hrs/day * 7 days = $133.56/week based on Grafana Dashboard
- Around $134.36/week based on AWS Cost Explorer
Based on these calculations, Grafana Dashboard provides a more accurate cost overview than Kubecost does. At the same time, it does not require any type of dependency and the solution is completely autonomous.
Architecture
Basic Structure
AWS Cost Explorer API incurs a charge of $0.01 per each paginated API request, and does not provide information in real time.
Based on cluster autoscaler info, we can apply a service to the AWS Pricing API to determine the cost per month/day/hour. Additionally, we could identify the equivalent core – GB ram per node. The goal is to have a fairly approximate idea of workload cost.
High Level Diagram
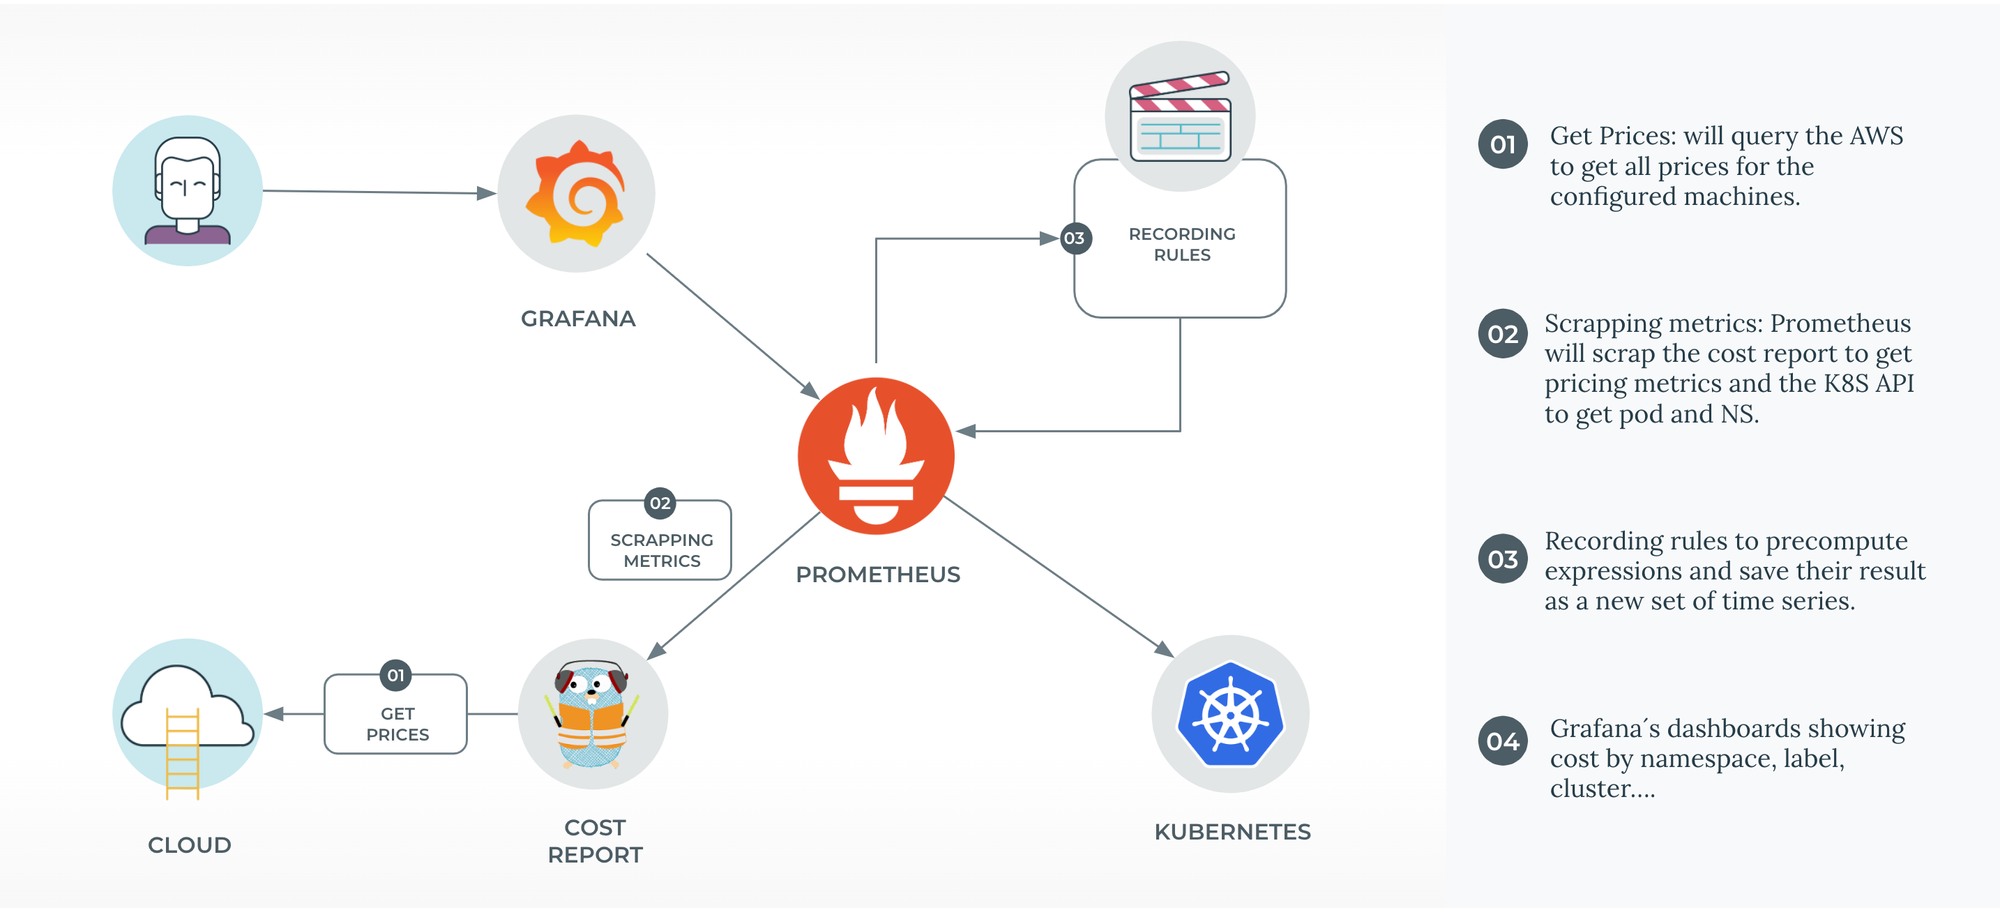
The above approach looks pretty simple: an app that exports cost metrics to Prometheus provides all the necessary dashboards in Grafana. Prometheus and Grafana are part of our monitoring stack, as they are for the vast majority of software companies nowadays. Therefore, after testing the solution at Empathy.co, we decided to make it open source so as to contribute to the community and embrace feedback.
Check out our repository on how to implement Kubernetes Cost Report using an EKS cluster.
The Kubernetes Cost allocation can be split into multiple layers:
- Cluster Cost: The sum of the cost of each node
Namespace Cost:
The Namespace Cost concept is usually used on Kubernetes to handle a group of pods, which can run in multiple nodes. The cost can be split into:
- Namespace Resource Requests: The sum of resources requests for each pod
- Namespace Resources Used: The sum of resources used for all the pods in that namespace
Pod Cost:
Each pod requests different resources, so the cost can be split into:
- Resource Requests: What each pod requests
- Resources Used: What each pod really used
The following diagram illustrates the difference between requests and usage.
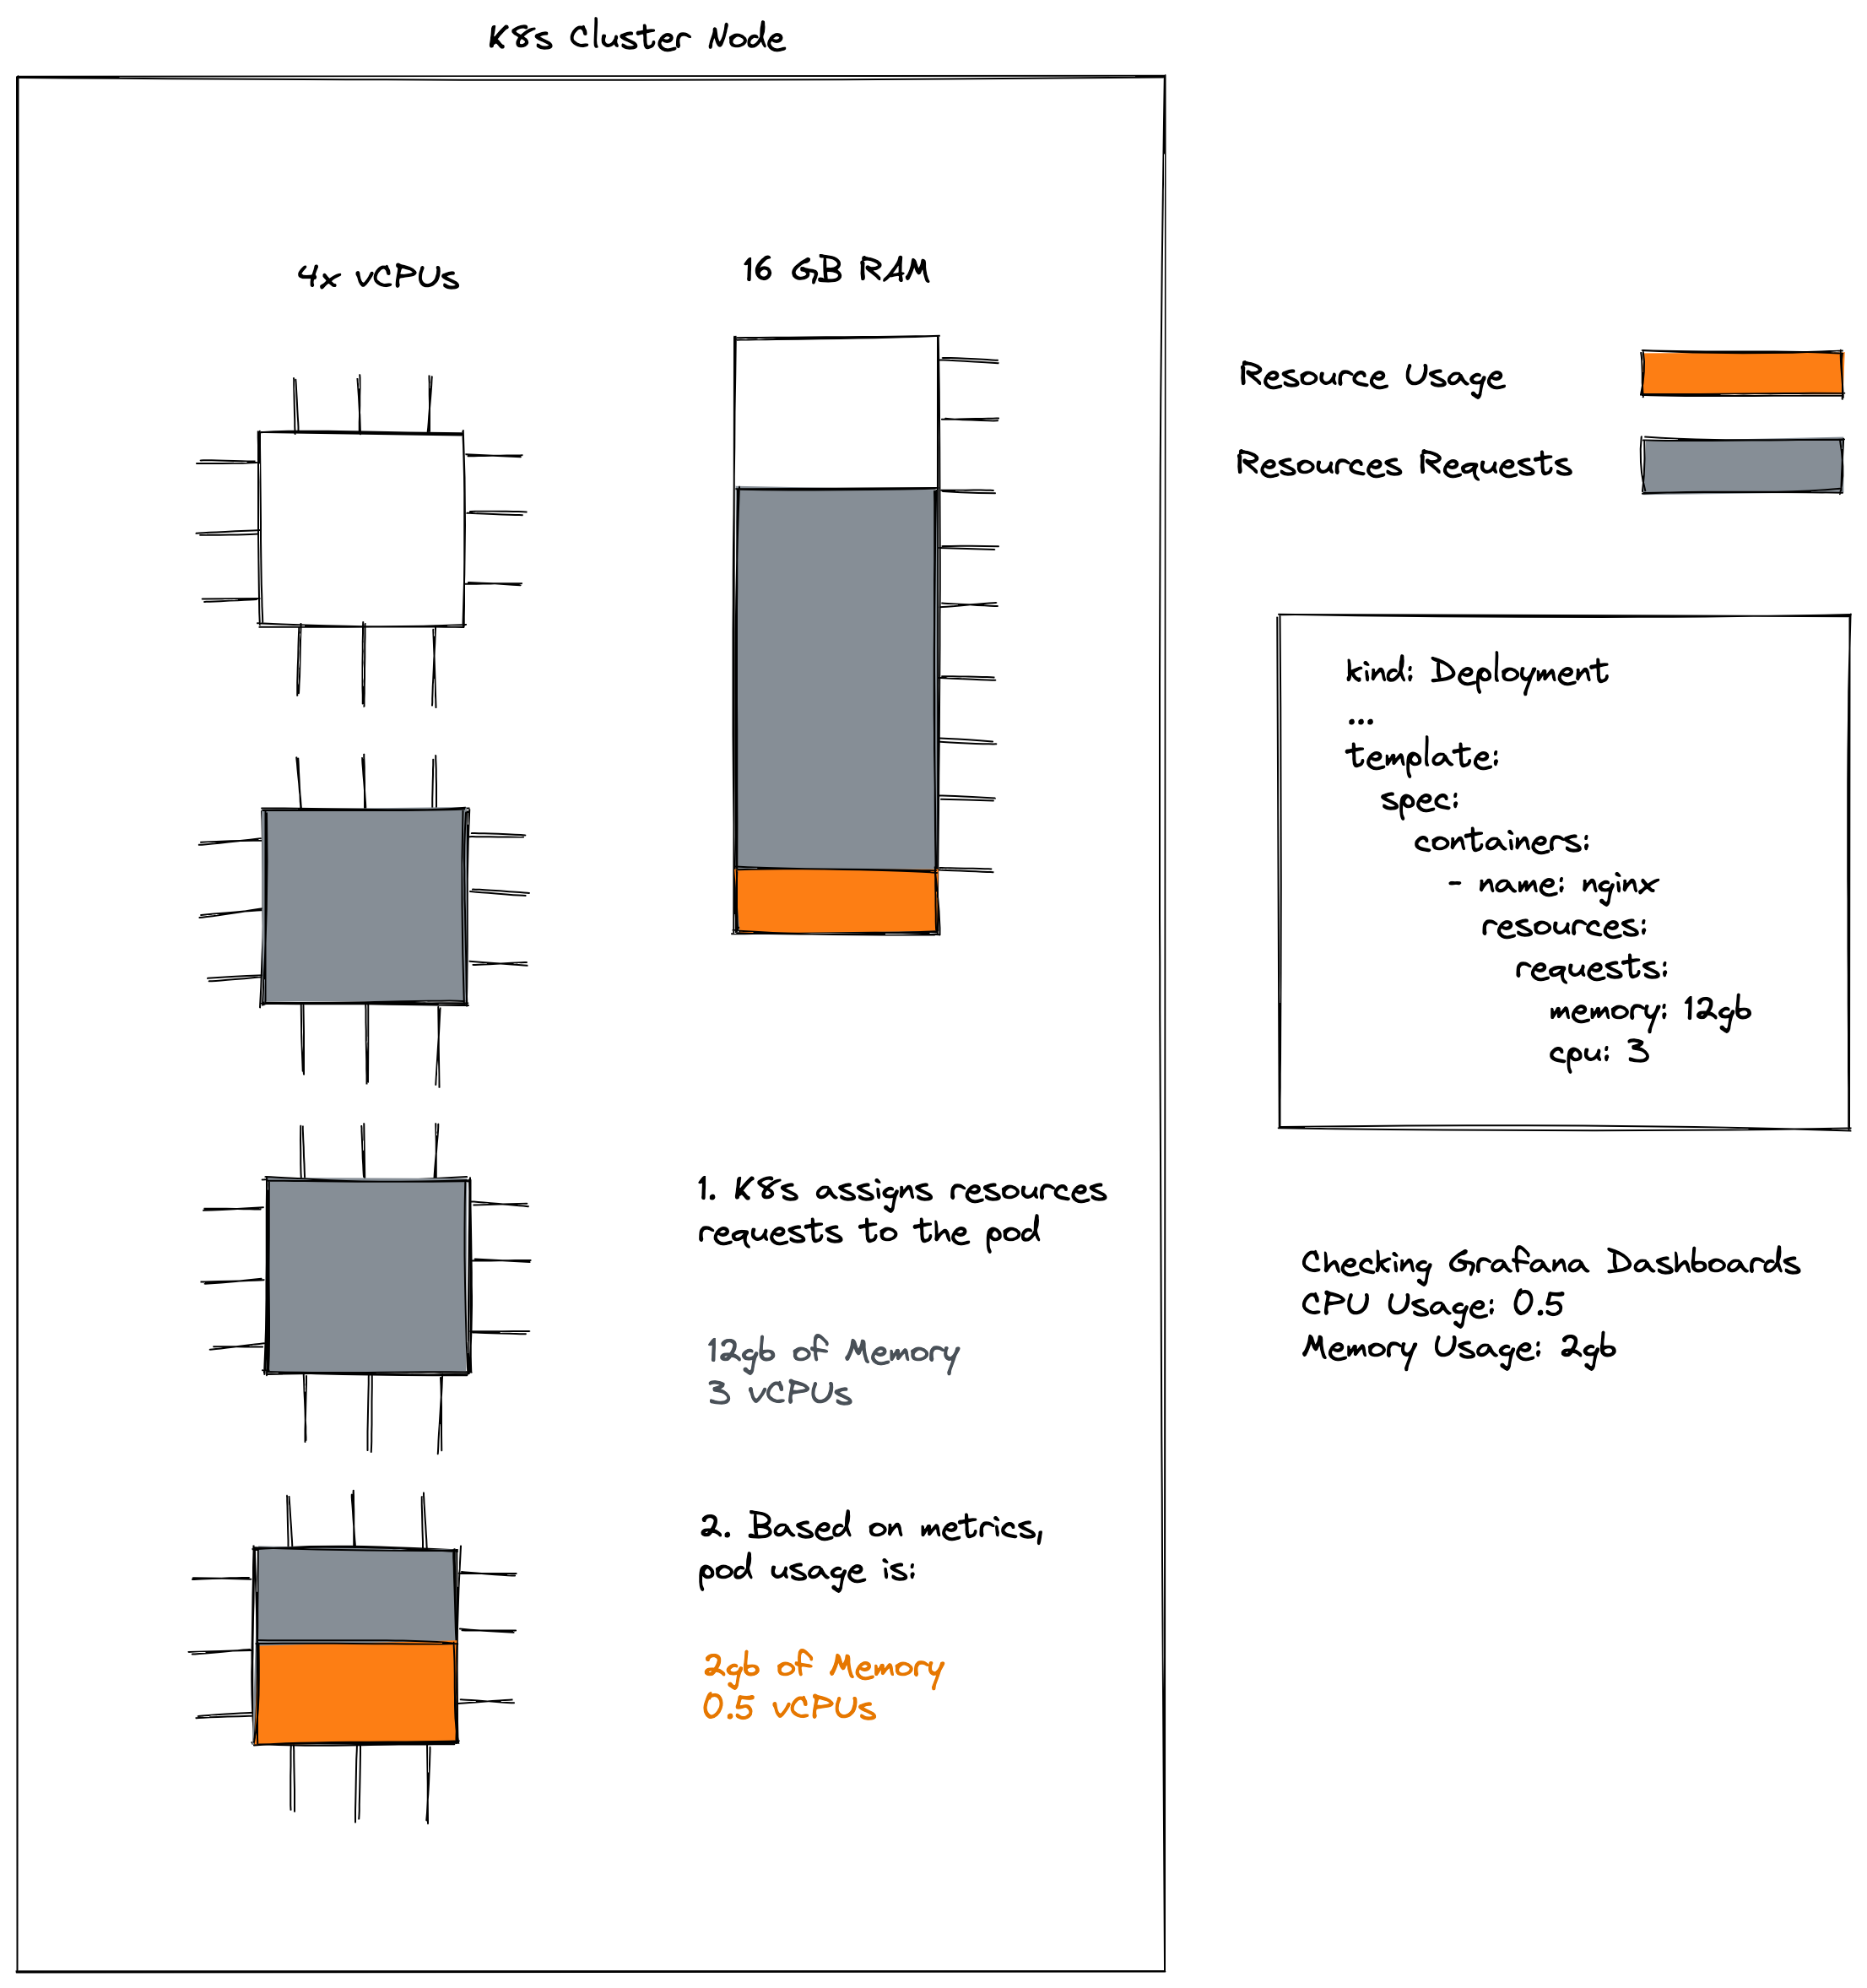
Resource Requests are those that are added to the final invoice, but knowing the usage allows underutilization to be measured and determine how much can be saved by doing a pod rightsizing.
Total Cluster Cost
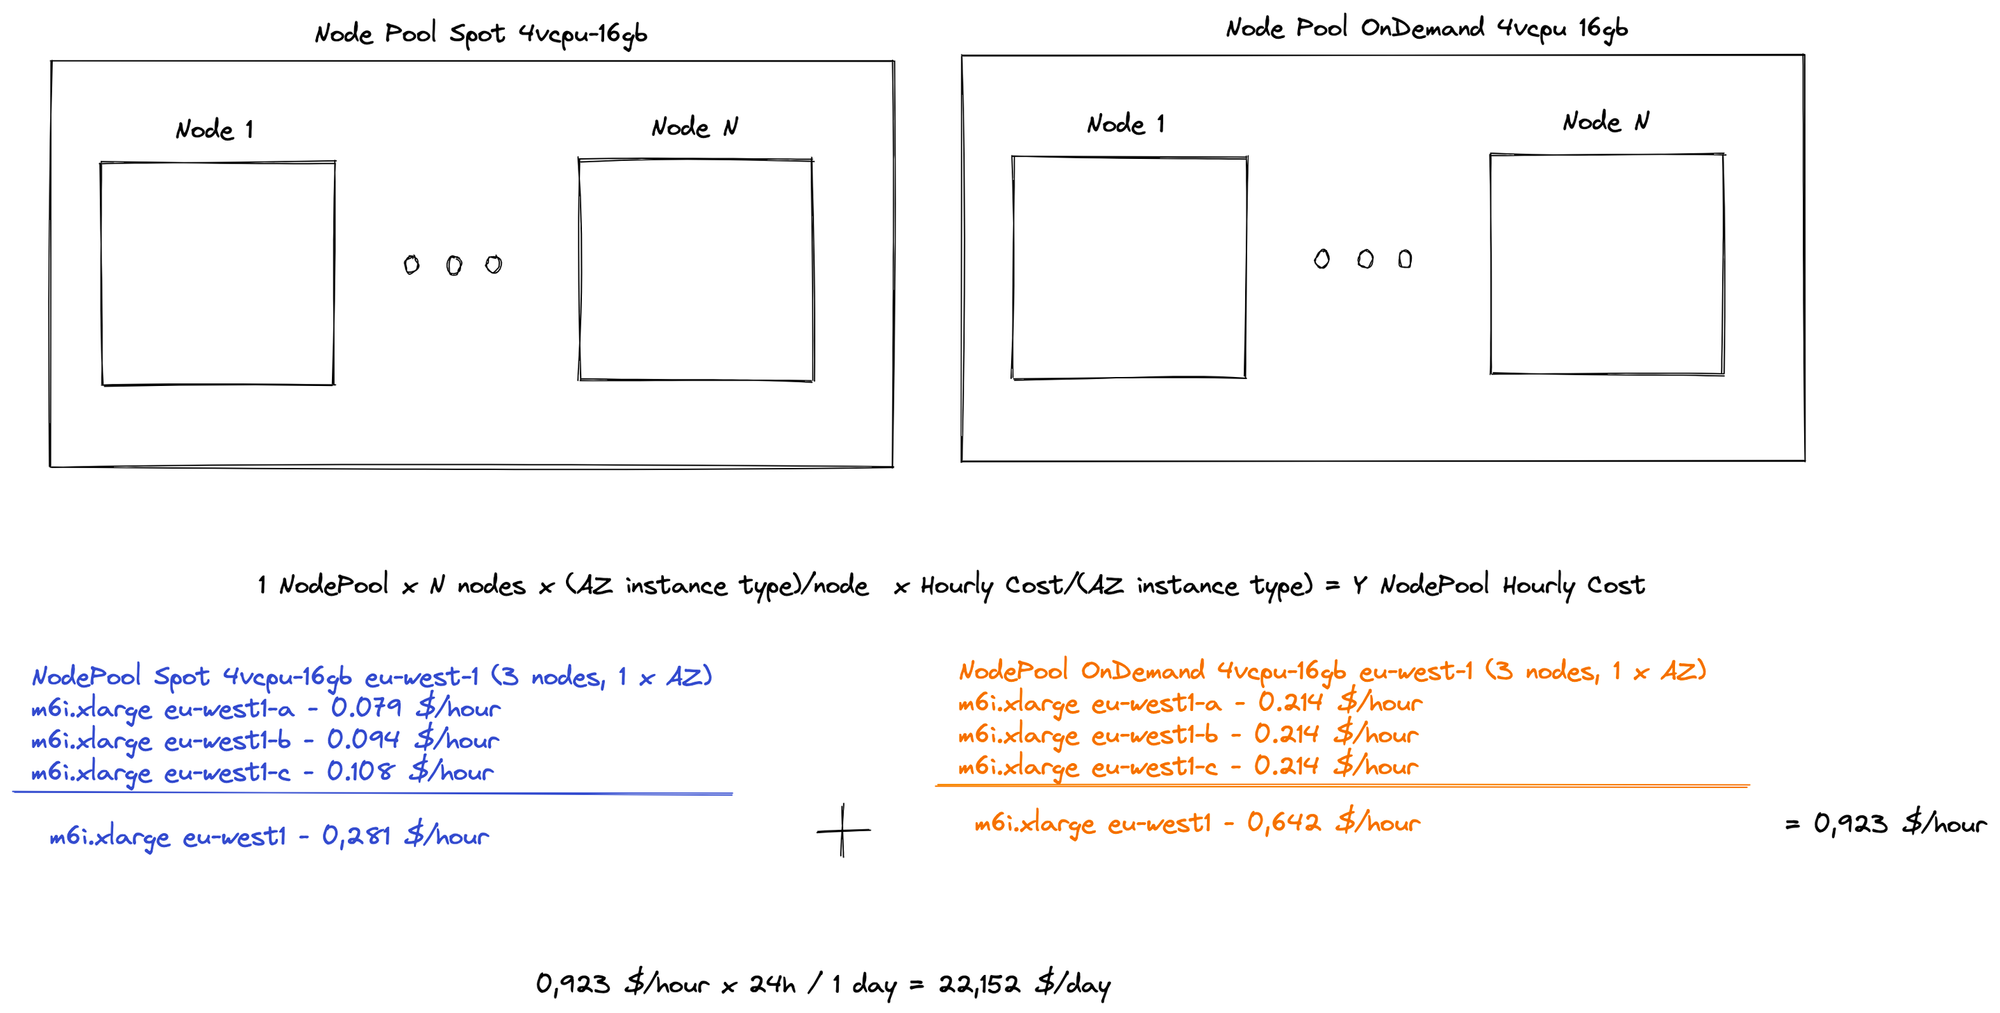
Knowing the instance type and the availability zone, the cost is simply a sum between different values based on the cost report deployment (the value of which is calculated by the AWS Pricing API every 12 hours).
Taxonomy of Total Cluster Cost
The total cluster cost presented above can be divided into a number of different costs, attending to their origins (that is, the resources they originate from):
- Usage Costs: As outlined above, these costs are related to the actual usage of resources coming from each pod.
- Request Costs: Stemming from the resource requests of each pod, as these requested resources have to be guaranteed.
- Underutilization Costs: As explained above, the difference between the resources a pod requests and those that it actually uses is labeled as underutilization. This difference is reserved for a given pod, even though it is not using it; so, no other pod can make use of it. In a sense, said pod is “hoarding“ but not actually using these resources. Hence, these costs can be calculated as Request Costs/Usage Costs.
- Available Costs: Related to the resources that no pod is reserving, hence available for any pod to use, i.e., to accommodate new workloads or spikes in currently running pods. It may seem tempting to reduce Available Costs to zero in order to reduce total costs, yet having a relatively small amount of Available Costs (and, therefore, available resources) is good practice to easily accommodate spikes in workloads or new workloads.
- Idle Costs: Originating from resources that are not being used in any sense, these costs encompass both Underutilization Costs and Available Costs (resources that are available for pod to use, but are not actually in use). These costs can be calculated as Underutilization Costs + Available Costs. The ideal situation would be to eliminate Underutilization Costs, so that Idle Costs = Available Costs. This situation basically means that no workload is “hoarding“ resources, and the idle resources that are at the ready can be used for spikes in workloads or new workloads.
- Shared Costs: These costs arise from resources that the actual Kubernetes cluster reserves for itself in order to work properly. No workload can use these resources, yet it is a price that must be paid for the cluster to work (think of these costs as the service costs, e.g., in your water bill - service availability, sewer charges, etc.). So, while we call them “Shared“ in the sense that they are not associated exclusively with any workload, they are costs that have to be paid by all workloads, in order to have a Kubernetes cluster. There is much more to be learned about allocatable resources.
To summarize the taxonomy, here’s a visual representation of one node and one pod running in that node:
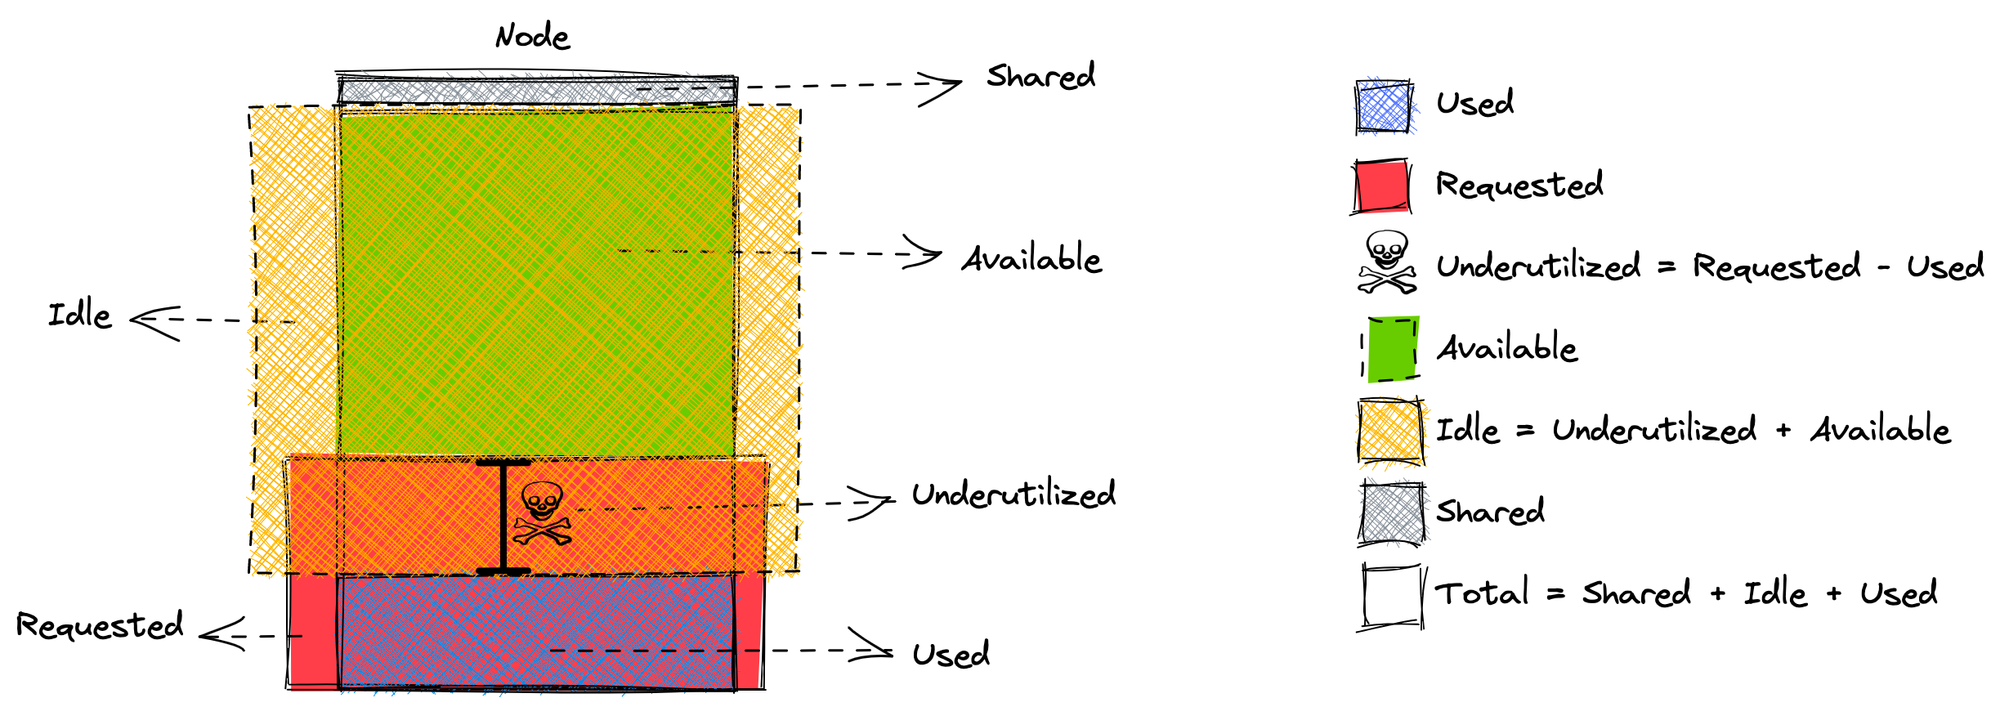
As diagrammed above, this taxonomy makes sense from a cluster point of view. Yet, digging down into namespaces and pods, only Used, Request, and Underutilization Costs can be associated with workloads (pods and/or namespaces). The following subsections will thus focus on calculating the Used, Request and Underutilization Costs per namespace and pod.
Namespace Cost
Based on the previous section, the instance type and therefore the amount of vCPUs and memory GB can be deduced. If the cost of each vCPU and each memory GB is known, pod cost and, therefore, namespace cost can be determined.
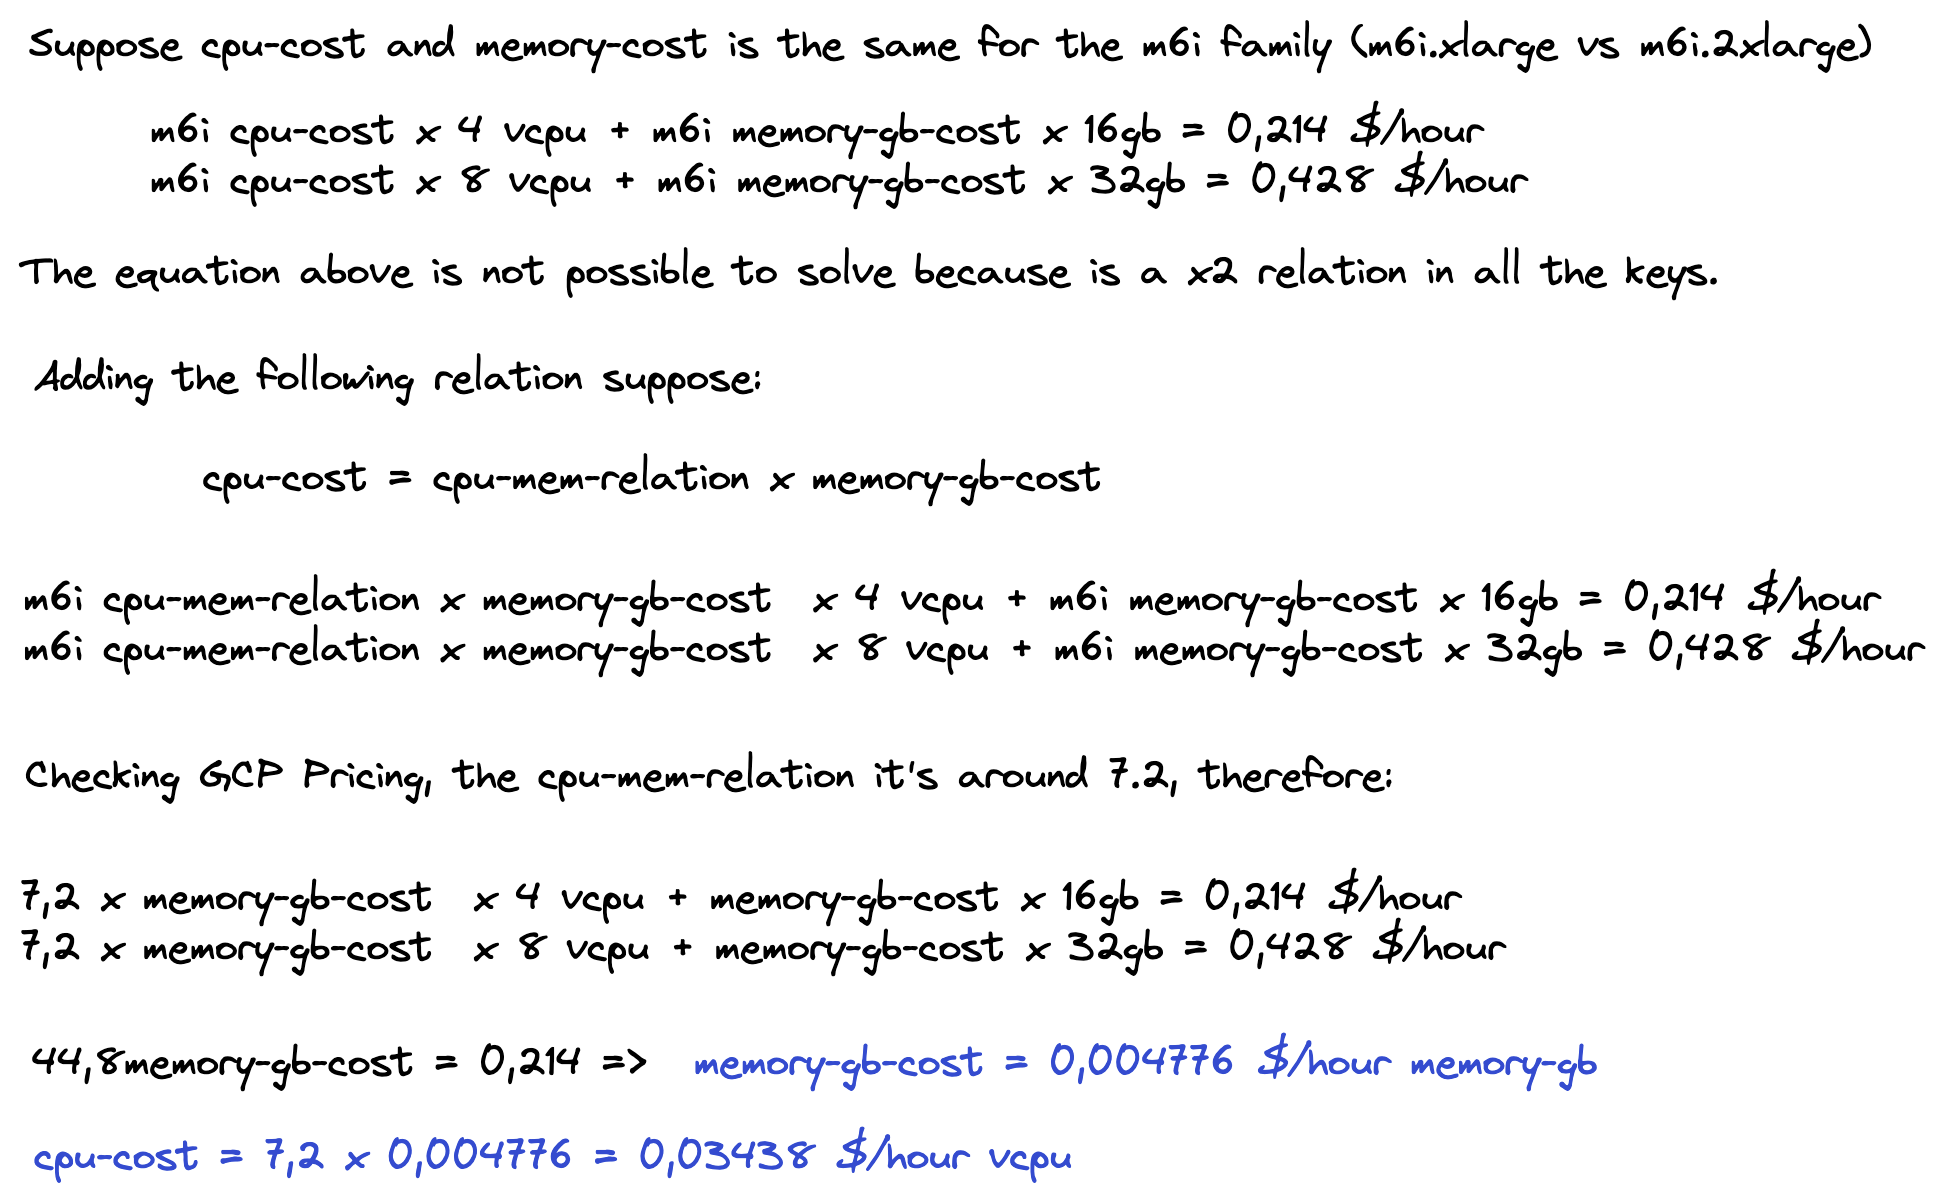
AWS doesn’t share the relationship between CPU and memory for each instance type, therefore we get this info from GCP. Obviously, it could be some differences between the cpu/memory relationship between the cloud providers but using the GCP relationship could give us a fairly approximate global idea and allow us know the cost of our pods and namespaces.
To simplify operations and taking into account an approximate global idea would be accepted the CPU-Memory relationship is calculated as:
CPU-cost = 7.2 memory-GB-cost
With that in mind, we can calculate namespace cost simply multiply and adding values. We know in what instance each pod is running, what requests and usage each pod has and what namespace is each pod. By now, the cost will be calculated hourly.
Pod Cost
Everything mentioned in the previous section will be applied to the pod cost. Let’s recap:
We know in which instance each pod is running, their usage and requests and their respective namespaces. For now, the cost will be calculated hourly.
Grafana Dashboards
Grafana is a well-known tool to display your metrics in magnificent dashboards. We’ve uploaded a couple of dashboards to Grafana Labs and on the exporter repo, too.
- An Exec Summary to focus on the highlights
- A detailed Kubernetes Cost Report for deeper analysis
Summary
The mission of the Kubernetes Cost Report is to provide a fairly approximate overall idea about the current cost of Kubernetes workloads, in order to:
- Develop an application to expose the pricing API in Prometheus. Gain visibility and control over third party tools, as well as a better understanding of the process. More info can be found in the repo empathyco/kubernetes-cost-report. It’s public, so don’t be shy!
- Get an instant, global idea of K8s cluster cost (since there’s no need to wait a couple of days to get cost from AWS Cost Explorer) and the workloads inside the cluster.
Grafana Dashboards
Future
- Underutilization Costs: How much does underutilization truly cost?
- Spot Capacity: Based on the latest deduction of spot instances, availability could be determined. This could potentially provide a better approach to select more available spot instance types and decrease costs.
- Minute precision: Get a minute approximation and learn how spot works in the first hour.
- Sustainability. Offer energy-efficient reports.
Kubernetes Cost Report: Takeaways
- Increased visibility of Kubernetes workloads costs
- Accessible and timely FinOps reports
- Everyone can take ownership of their cloud usage
- Decisions can be driven by the business value of the cloud
Now that you have learned how to gain cost visibility on your Kubernetes cluster and the associated benefits of adopting Cloud FinOps practices on your workloads, more info can be found on kubernetes-cost-report repo.
References

 kubecostkubecost
 Ivan Velichko
 Carlos Arilla
 empathyco
 Daniele Polencic